


Nowadays, most of the web applications use charts to visualize data and provide as much information as possible with a user-friendly interface. Chart displays your data graphically and lets you understand data flow and other small and necessary things of your projects easily. Visualizing charts can help you to understand complex data easily which may results in improved productivity and reliability for your web applications & projects.
There are number of useful JavaScript chart and graph libraries out there that have support for many features: interactivity, multiple chart types, line charts, pie charts, and many more.
For this article I explored myriad of JavaScript chart and graph libraries and found 50 Best JavaScript Chart and Graph Libraries that help you to create simple chart to complex charts easily. Most of them are free for personal and commercial use and you can use them according to your needs to crate and visualize your data in the form of charts and graphs.
If you are aware of any other JavaScript Chart and Graph Libraries, please do let us know by posting a comment below. We would love to hear your feedback.
1. JSCharting
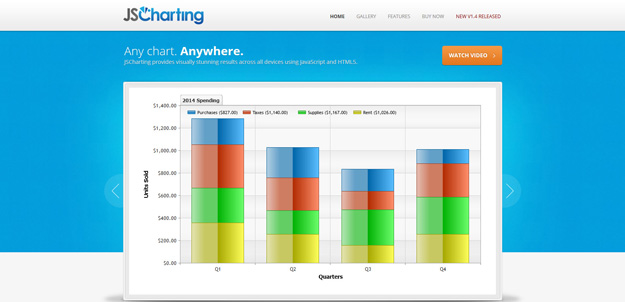
JSCharting is an exceptional and premium charting library offering a painless way of adding interactive charts to your commercial products.
JSCharting currently supports bar and column charts, lines, splines, steplines, advanced combination types, finance, stock charts, pies, donuts, and scatter charts plus new types on every JSCharting release!
JSCharting Library includes full suite of JSMapping functionality and provides access to highly tuned set of maps for all countries/states/provinces in the world. It also comes with an amazing code expansion feature where it allows aliasing any property by typing it out in a single name, and on other hand Data Visual Shading provides visual shadings for chart data.
JSCharting is compatible with most common browsers — including IE6/7/8/9+, Chrome, Firefox, Safari and Opera and supports devices like smart phones, tablets, and Mac computers.
JSCharting is very well-documented and comes with pro support. The library has a detailed pricing structure that covers many use-cases like: commercial website, OEM and integrated usage, Saas app and more, while you can go with a trial version by filling up a simple form.
2. D3.js
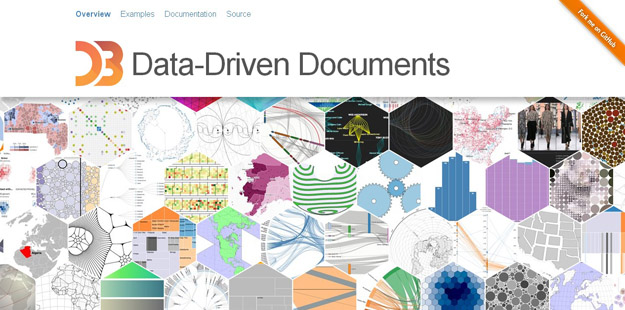
D3.js is a JavaScript library for manipulating documents based on data. D3 helps you bring data to life using HTML, SVG and CSS. D3’s emphasis on web standards gives you the full capabilities of modern browsers without tying yourself to a proprietary framework, combining powerful visualization components and a data-driven approach to DOM manipulation.
3. Yako.js
Yako.js is a tiny DOM-less graph library, build for fast front end and server side rendering in CommonJs pattern. This library is intend to generate light weight and simple SVG graphs, and is more performable compare to highcharts / flot / c3 / d3 when front end matters.
4. tauCharts
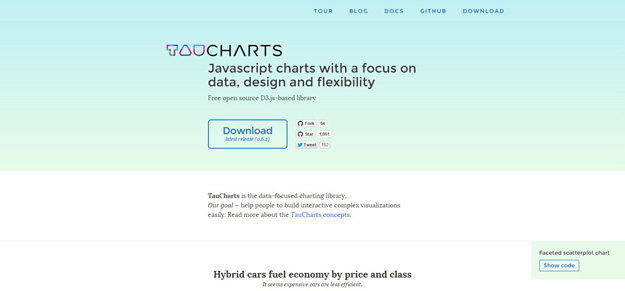
tauCharts is a Javascript charting library with a focus on design and flexibility. It’s open source and based on D3.js
5. Ember Charts
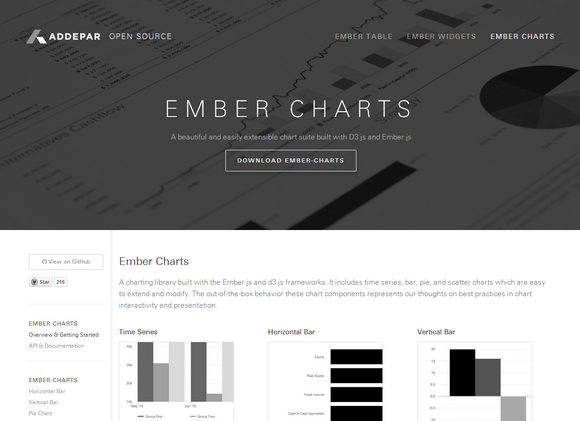
Ember Charts is a charting library built with the Ember.js and d3.js frameworks. It includes time series, bar, pie, and scatter charts which are easy to extend and modify. The out-of-the-box behavior these chart components represents their thoughts on best practices in chart interactivity and presentation.
6. Cubism.js
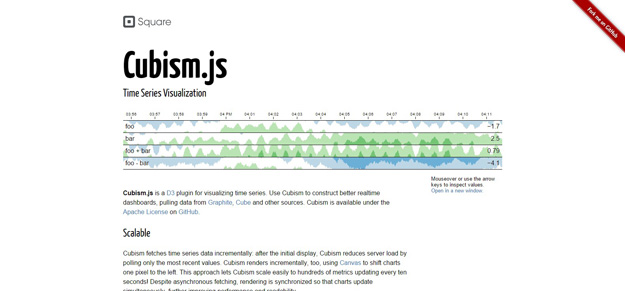
Cubism.js is a javascript library for visualizing time series. Use Cubism to construct better realtime dashboards, pulling data from Graphite, Cube and other sources.
7. ZingChart
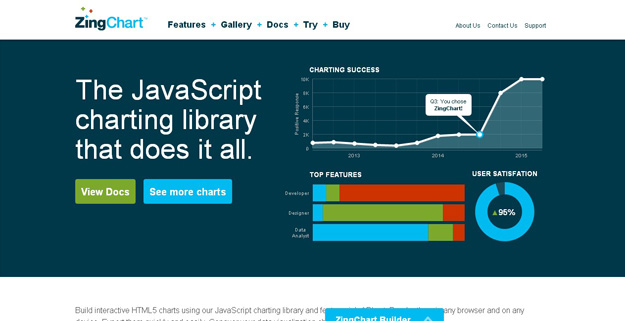
ZingChart is a powerful library providing users with the ability to quickly create beautiful charts, dashboards, and infographics. Choose from hundreds of chart types with nearly limitless chart design and customization options.
8. ECharts
ECharts is a comprehensive charting library offering a painless way of adding interactive charts to your products. ECharts currently supports line, column, scatter, pie, radar, candlestick, chord, gauge, funnel, map and force-directed chart types, many of these can be combined in one chart.
9. MetricsGraphics.js
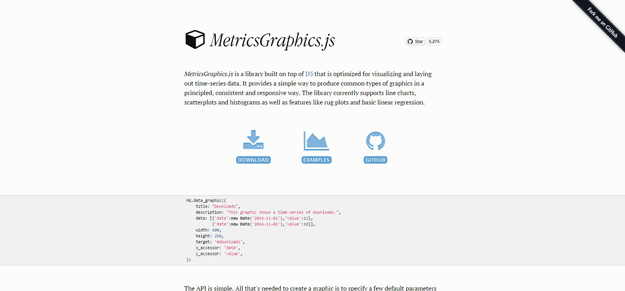
MetricsGraphics.js is a library optimized for visualizing and laying out time-series data. It provides a simple way to produce common types of graphics in a principled, consistent and responsive way. The library currently supports line charts, scatterplots and histograms as well as features like rug plots and basic linear regression.
10. Chartist.js

Chartist.js is a simple responsive charting library built with SVG. Chartist’s goal is to provide a simple, lightweight and non-intrusive library to responsive craft charts on your website. Chartist works with inline-SVG and therefore leverages the power of the DOM to provide parts of its functionality. This also means that Chartist is not providing it’s own event handling, labels, behaviors and anything else that can just be done with plain HTML, JavaScript and CSS.
11. Timesheet.js
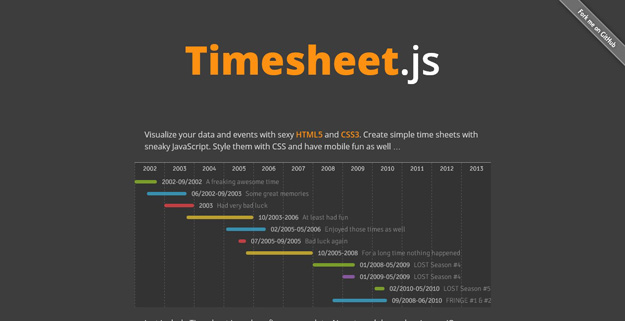
Timesheet.js is a javascript library for simple HTML5 & CSS3 time sheets. You can visualize your data and events with sexy HTML5 and CSS3 with few lines JavaScript.
12. P5.JS
A JS client-side library for creating graphic and interactive experiences, based on the core principles of Processing.
13. Plottable.js
Plottable.js is a library for easily creating flexible, interactive, and performant charts for the web. It is built on top of D3 and provides higher-level pieces, like plots, gridlines, and axes. As such, it’s easier to quickly build charts.
14. dc.js
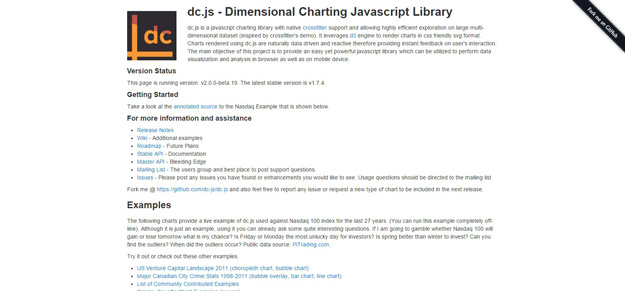
dc.js is a javascript charting library with native crossfilter support and allowing highly efficient exploration on large multi-dimensional dataset.
The main objective of this library is to provide an easy yet powerful javascript library which can be utilized to perform data visualization and analysis in browser as well as on mobile device.
15. Chart.js
Chart.js is an easy, object oriented client side graphs for designers and developers. You can visualise your data in 6 different ways. Chart.js uses the HTML5 canvas element. It supports all modern browsers, and polyfills provide support for IE7/8. Chart.js is dependency free, lightweight (4.5k when minified and gzipped) and offers loads of customization options.
16. Epoch
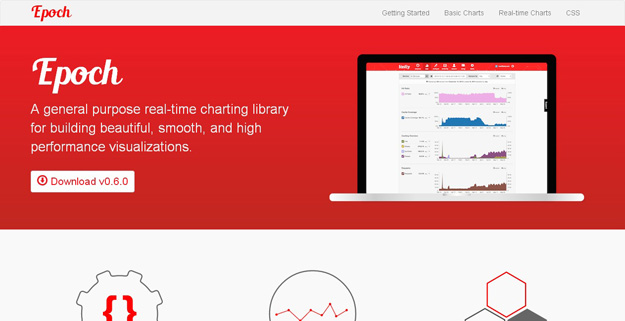
Epoch is a general purpose real-time charting library for building beautiful, smooth, and high performance visualizations. It focuses on two different aspects of visualization programming: basic charts for creating historical reports, and real-time charts for displaying frequently updating timeseries data.
17. Cytoscape
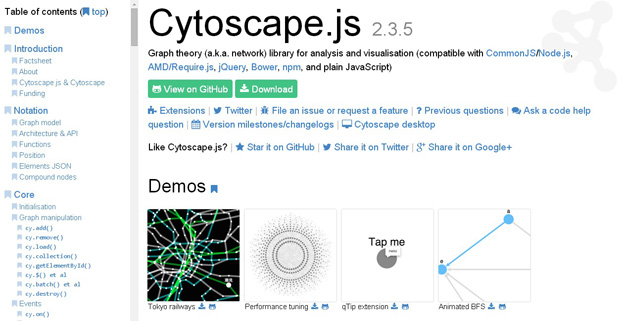
Cytoscape.js is an open-source graph library written in JavaScript. You can use Cytoscape.js for graph analysis and visualisation. It’s compatible with CommonJS/Node.js, jQuery 1.4+, and plain JavaScript. .
18. FlowChart.js
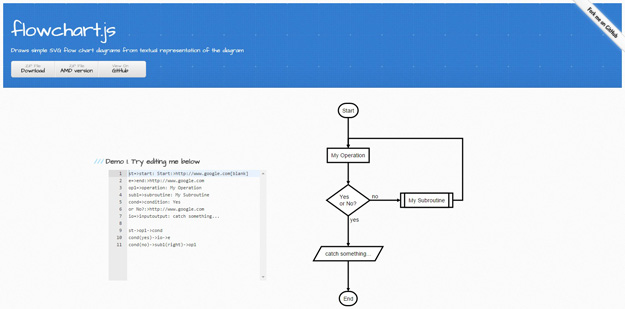
Flowchart.js draws simple SVG flow chart diagrams from textual representation of the diagram. Also diagrams can be with color view too.
19. Sigma.js
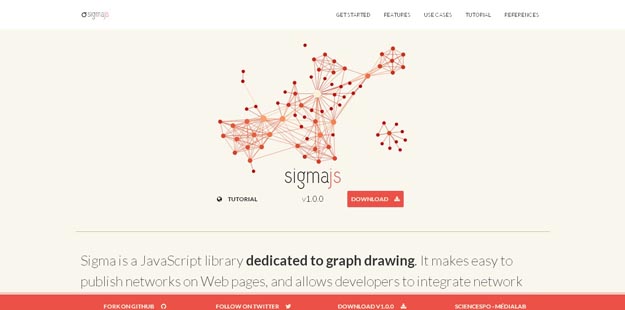
Sigma is a JavaScript library dedicated to graph drawing. It makes easy to publish networks on Web pages, and allows developers to integrate network exploration in rich Web applications. Sigma provides a lot of built-in features, such as Canvas and WebGL renderers or mouse and touch support, to make networks manipulation on Web pages smooth and fast for the user.
20. X Charts
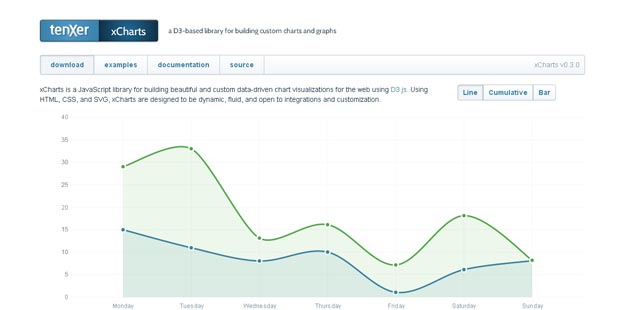
xCharts is a JavaScript library for building beautiful and custom data-driven chart visualizations for the web using D3.js. Using HTML, CSS, and SVG, xCharts are designed to be dynamic, fluid, and open to integrations and customization.
21. Raphael.js
Raphaël is a small JavaScript library that should simplify your work with vector graphics on the web. If you want to create your own specific chart or image crop and rotate widget, for example, you can achieve it simply and easily with this library.
22. Hightcharts.js
HighchartsJS is a charting library written in pure JavaScript, offering an easy way of adding interactive charts to your web site or web application. Highcharts JS currently supports line, spline, area, areaspline, column, bar, pie and scatter chart types.
23. Amcharts.js
AmCharts is an advanced charting library that will suit any data visualization need. AmCharts includes Column, Bar, Line, Area, Step, Step without risers, Smoothed line, Candlestick, OHLC, Pie/Donut, Radar/ Polar, XY/Scatter/Bubble, Bullet, Funnel/Pyramid charts as well as Gauges.
24. SmoothieCharts
SmoothieCharts is a really small charting library designed for live streaming data. Joe Walnes wanted to show real time streaming data pushed over a WebSocket. Although many of the charting libraries allow you to dynamically update data, none have really been optimized for a constant stream of data.
25. Plotkit
PlotKit is a Chart and Graph Plotting Library for Javascript. It has support for HTML Canvas and also SVG via Adobe SVG Viewer and native browser support. It is fully documented and easy to use.
26. CanvasXpress
CanvasXpress is a standalone HTML5 graphing library written in Javascript that includes a simple and unobtrusive user interfase to explore complex data sets. CanvasXpress is supported in all major browsers in computers and mobile devices.
27. JSXGraph
JSXGraph is a cross-browser library for interactive geometry, function plotting, graphs, and data visualization in a web browser. It is implemented totally in JavaScript and uses SVG and VML. It supports many, basic to advanced, mathematical functions that make creating complex visualizations easier.
28. EnvisionJS
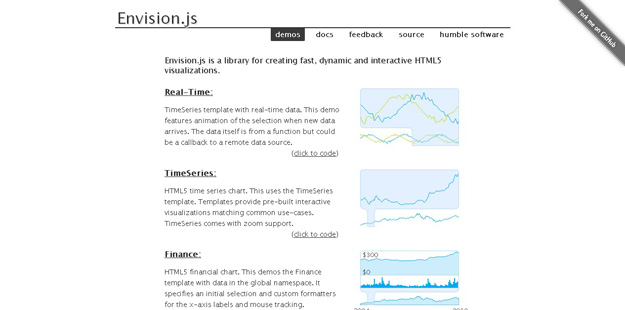
Envision.js is a JavaScript library to simplify creating fast and interactive HTML5 visualizations. It comes with 2 chart types; TimeSeries + Finance and with an API for developers to build custom charts. The library is built on top of Flotr2 and the HTML5 Canvas. It is framework agnostic and depends on few micro libraries.
29. rGraph
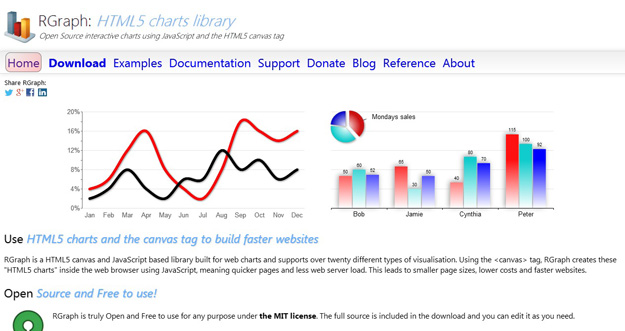
RGraph is a HTML5 canvas and JavaScript based library built for web charts and supports over twenty different types of visualisation. Using the canvas tag, RGraph creates these “HTML5 charts” inside the web browser using JavaScript, meaning quicker pages and less web server load. This leads to smaller page sizes, lower costs and faster websites.
30. AwesomeChartJS
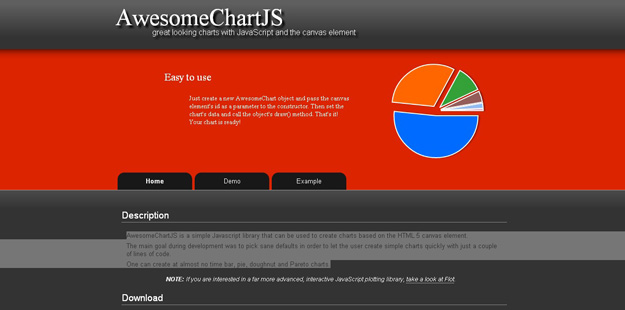
AwesomeChartJS is a simple Javascript library that can be used to create charts based on the HTML 5 canvas element. The main goal during development was to pick sane defaults in order to let the user create simple charts quickly with just a couple of lines of
31. Arbor
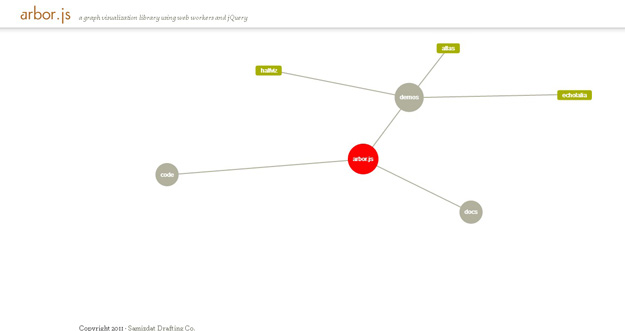
Arbor is a graph visualization library built with web workers and jQuery. Rather than trying to be an all-encompassing framework, arbor provides an efficient, force-directed layout algorithm plus abstractions for graph organization and screen refresh handling.
32. Flotr
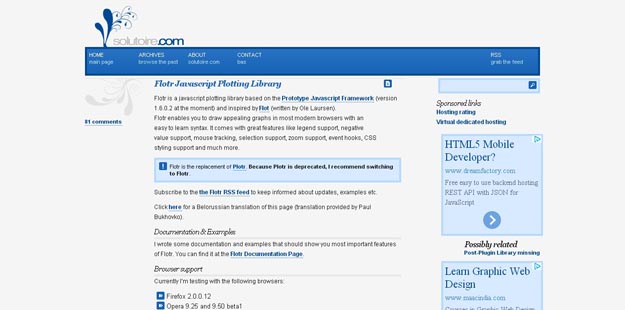
Flotr is a javascript plotting library based on the Prototype Javascript Framework (version 1.6.0.2 at the moment) and inspired by Flot (written by Ole Laursen). It comes with great features like legend support, negative value support, mouse tracking, selection support, zoom support, event hooks, CSS styling support and much more.
33. Grafico
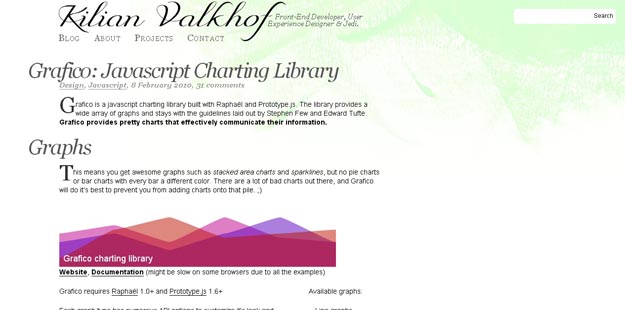
Grafico is a javascript charting library built with Raphaël and Prototype.js. The library provides a wide array of graphs and stays with the guidelines laid out by Stephen Few and Edward Tufte.
34. Sparky
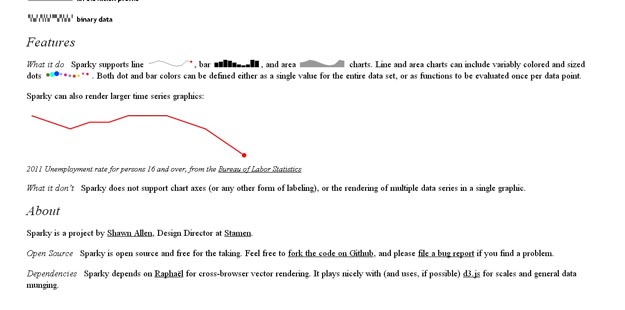
Sparky is a free JavaScript sparklines library that depends on Raphaël and very easy to use. It has support for multiple chart types (line, bar and area) where line + area charts can have multiple colors as well.
35. ElyCharts
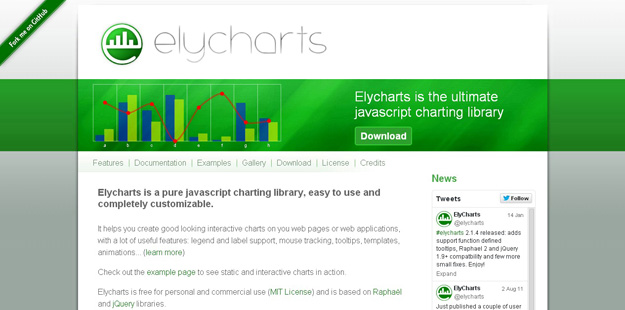
Elycharts is an easy-to-use and customizable library for creating charts with only JavaScript. The library supports most of the popular chart types including line, column, are, bar, pie, sparklines and combinations. Elycharts comes with many interactions like mouse tracking and events, highlight of selected areas with various animations, tooltip and hints, html anchors and many more.
36. CanvasJS
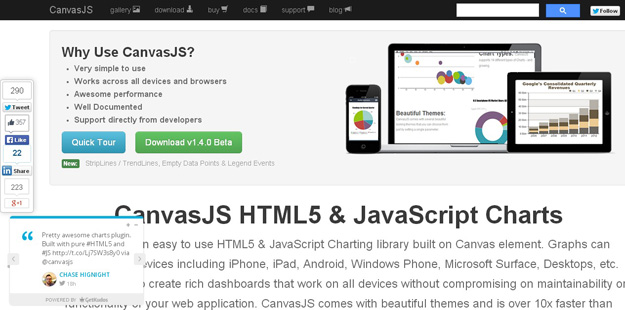
CanvasJS is an easy to use HTML5 & JavaScript Charting library built on Canvas element. Graphs can render across devices including iPhone, iPad, Android, Windows Phone, Microsoft Surface, Desktops, etc. This allows you to create rich dashboards that work on all devices without compromising on maintainability or functionality of your web application.
37. Morris.js
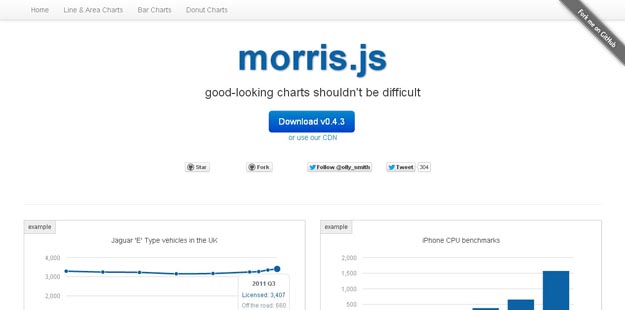
Morris.js is the library that powers the time-series graphs. It’s a very simple API for drawing line, bar, area and donut charts.
38. JS Charts
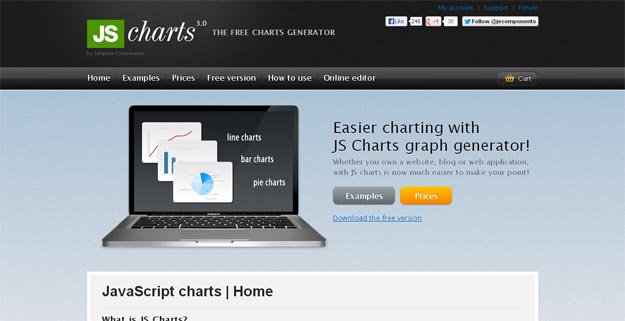
JS Charts is a JavaScript based chart generator that requires little or no coding. With JS Charts drawing charts is a simple and easy task, since you only have to use client-side scripting (i.e. performed by your web browser). No additional plugins or server modules are required.
39. Springy.js
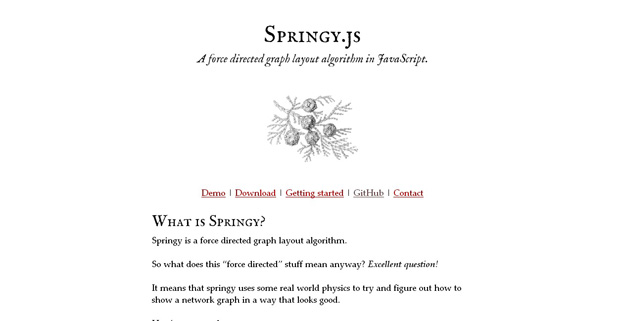
Springy.js is a JavaScript library that relies on an algorithm to create force-directed graphs, resulting in nodes reacting in a spring-like manner on the web page. Although Springy.js comes configured with a predefined algorithm, options such as spring stiffness and damping can easily be passed as parameters.
40. jFreeChart
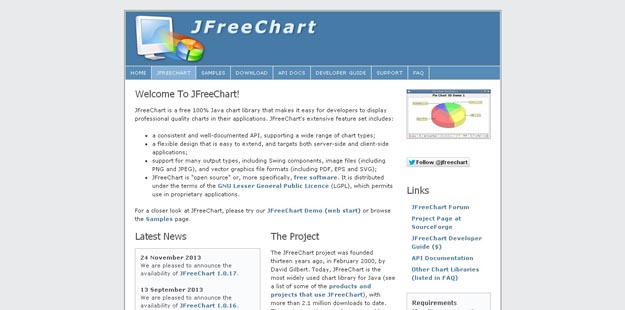
JFreeChart is a free 100% Java chart library that makes it easy for developers to display professional quality charts in their applications.The JFreeChart project was founded seven years ago, in February 2000, by David Gilbert.
41. C3.js
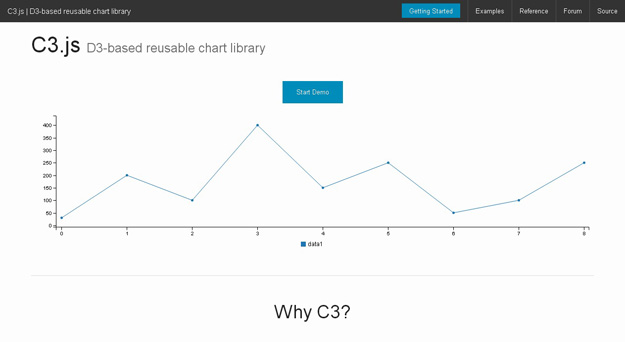
C3.js is a D3-based chart library that allows you to integrate charts into web applications more deeply.
42. Dygraph.js
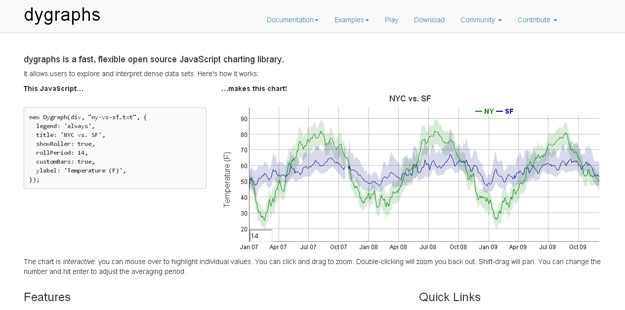
Dygraphs is fast, flexible open source JavaScript charting library. It allows users to explore and interpret dense data sets. ou can mouse over to highlight individual values. Click and drag to zoom. Double-click to zoom back out.
43. JointJS
JointJS is a modern HTML 5 JavaScript library for visualization and interaction with diagrams and graphs. It can be used to create either static diagrams or, and more importantly, fully interactive diagramming tools and application builders.
44. Vis.js
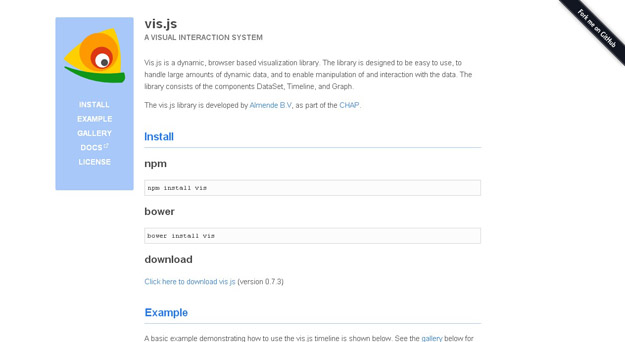
Vis.js is a dynamic, browser based visualization library. The library is designed to be easy to use, handle large amounts of dynamic data, and enable manipulation of the data. The library consists of the following components: DataSet and DataView.
45. Bluff
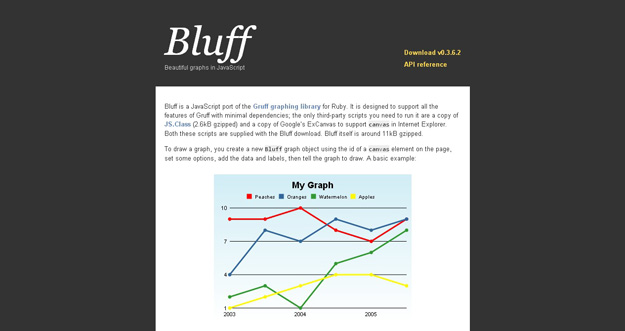
Bluff is a JavaScript port of the Gruff graphing library for Ruby. It is designed to support all the features of Gruff with minimal dependencies; the only third-party scripts you need to run it are a copy ofJS.Class (2.6kB gzipped) and a copy of Google’s ExCanvas to support canvas in Internet Explorer.
46. Planetary.js
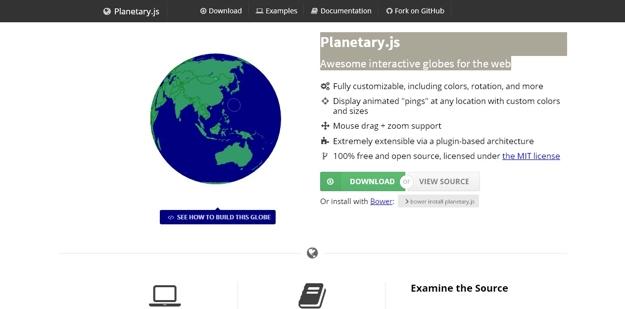
Planetary.js is a javaScript library for building awesome interactive globes. It uses D3 and TopoJSON to parse and render geographic data. Planetary.js uses a plugin-based architecture; even the default functionality is implemented as plugins! This makes Planetary.js extremely flexible. It’s fully customizable, including colors, rotation, and more.
47. Aristochart
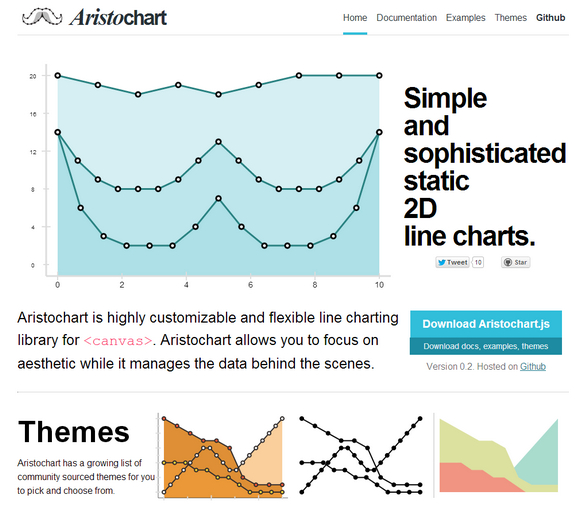
Aristochart is highly customizable and flexible line charting library for canvas. Aristochart allows you to focus on aesthetic while it manages the data behind the scenes. Aristochart has a growing list of community sourced themes for you to pick and choose from.
48. Heatmap.js
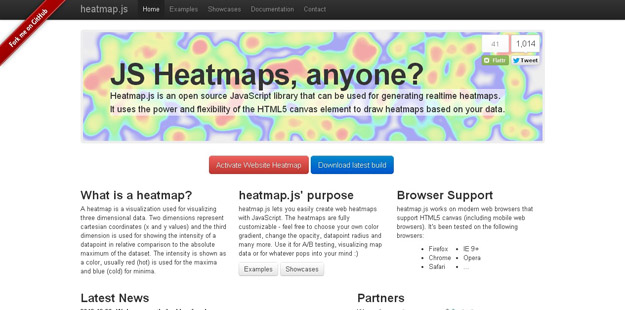
Heatmap.js makes dynamic heatmaps for the web. This JavaScript library will help you make your 3 dimensional data speak up. Use heatmap.js v2.0 to add new value to your project, build a business based on it, study and visualize user behaviour, and much more. Heatmap.js v2.0 is the most advanced heatmap visualization library on the web.
49. Circles
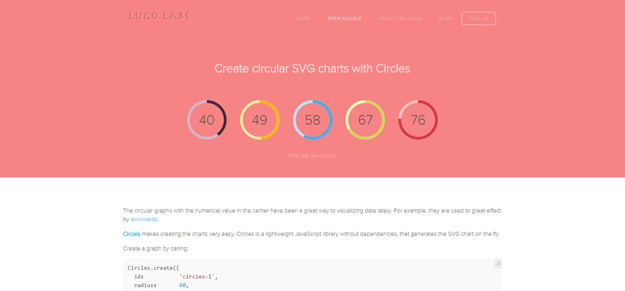
Circles is a lightweight JavaScript library that generatescircular graphs in SVG. It makes creating the charts very easy.
50. WebCola

WebCola is an open-source JavaScript library for arranging your HTML5 documents and diagrams using constraint-based optimization techniques. It works well with libraries like D3.js and svg.js


yGuy
Nice list! It would be cool if you could separate the graphing from the charting libraries. They are both about visualization and there are a few libraries that can be used for both, but these are actually very different topics.
The most comprehensive graph drawing library available commercially is yFiles for HTML. It offers the most advanced and complete set of automatic layout algorithms. See the online demo browser here: http://live.yworks.com/demobrowser/
Peter
How does “JFreeChart is a free 100% Java chart library” fit into a list of JavaScript libraries? (Java !== JavaScript; You know that, right?)