
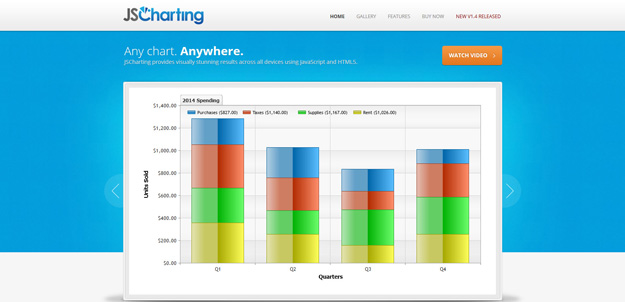


JavaScript Charting Library helps in creating visually stunning charts, across various devices. From PC to tablets, and even smartphone, this charting can be used on any platform. It helps in offering clients various types of charts, including a pie chart, a bar chart, or one of the many available types.
There are hundreds of features, which are readily available with the help of JS Charting support content and applications. The primary aim of these features is to meet some of your advanced requirements from international and globalized supports to some of the advanced visuals.
Additionally, you will receive real time results along with interactivity, as some of the additional features.
Working on the chart Type
There are loads of chart types (90+ with 3D support), which are waiting for you, once you have availed services of JavaScript Charting Library. You will receive chart type for any business need. The best part is that the service is made responsive. Therefore, now you can avail the help of these charts on your tablet or smartphones. The gallery comprises of column charts and bar, splines, lines, advanced combination types, step lines, stock and finance charts. On the other hand, you will receive other types of charts as well, like donuts, pies and scatter charts. With the growing demands of customers, the technical team is working on adding some extra types of charts too.
Get to the Features
There are different types of features, making JSCharting the best choice for business owners. Now presenting even the complex of all statistics will be an easy task, with graphics and charts. Some of the promising features are mentioned below:
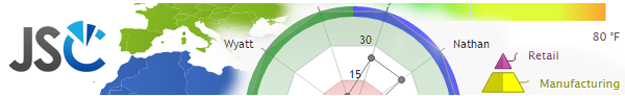
1) JS Mapping charts: Each one of the JSCharting licenses comprises of a full suite of JSMapping function, without any further cost. You will be able to access advanced and highly tuned map set, for all states, provinces or countries globally. You are free from adding any special coding or mapping expertise. Additionally, the users will receive map overlays, thematic mapping, and dynamic loading, as some of the supportive features. To know more about these maps and learn using them, you have to go through the gallery samples and the features.
2) Label Tokens: Tokens are primarily used in labels for representing values and offer simpler ways to manipulate label text. Sometimes, extensive label token is used for supporting Series, Series Collection, Value, and Point. You will receive label expression, for calculating expression values within label token text. Get to know more about label hover cursor setting and label URL. Some other forms of label tokens are label alignment, label rotation, label absolute positioning and styling from CSS.
3) Code expansion: Through JSCharting, you will receive automatic code expansion, which helps in aliasing property by typing it with a single name. This chart helps in detecting and expanding properties in an automatic manner. This feature even helps in saving some of your valuable time, by eliminating extra keystrokes. It helps in achieving property settings without the use of code expansion.
This chart demonstrates a number of advanced features in one chart.
See the Pen by Arthur Puszynski (@jsblog) on CodePen.
Additional services and benefits
Apart from the points mentioned above, JavaScript Charting Library helps in offering users with data visual shading. It helps you to enjoy an experience of unsurpassed data shading. This section is primarily divided into three basic sections; default shading effects, bar shading effects and color automation.
Additionally, you will also receive smart tooltips. Here, the chart detects the type of data used and creates an informative tooltip, automatically. You will also be able to enjoy the services of formatting and globalization. It helps in easy and quick labeling in different languages. You will receive complete set of string, which supports data formats and all types of numeric formats, as well. It comprises of customized format strings, as well.


Leave a Reply